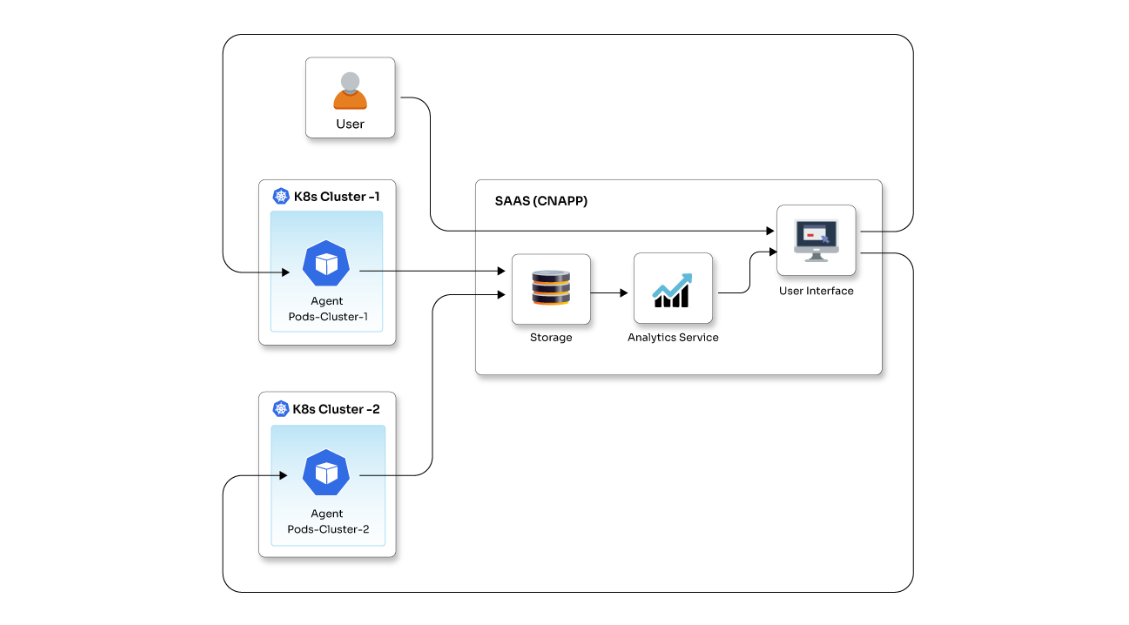
With the advancements in the cloud and changing SDLC processes, almost everybody needs a top-notch monitoring system to ensure everything is in place and performing at its peak. Observability is one of the significant areas that can ensure your system's health and performance is visible and monitored effectively. Observability is the ability to measure a system's internal state by inspecting its outputs. It relies on telemetry derived from the services and endpoints of cloud environments. Observability's goal is to understand the events around these environments so that you can locate issues and resolve them, and in turn, boost system efficiency and keep customers happy. A system can be termed observable only if you can estimate its current state from its output information. An FMI study found that the observability platform market will rise at an astounding rate - from US$ 2,174 Million in 2022 to US$ 5,553 Million by 2032.
While observability may seem like a new buzzword, it originated decades ago and has been increasingly applied to boost distributed IT systems' performance. Observability tools use three kinds of telemetry data to work and provide deep visibility into distributed systems: traces, logs, and metrics. This data is pivotal in locating the root cause of issues that IT personnel can use to enhance system performance.
In this blog, I will break down observability for you. We'll look at the components of observability, reasons for adoption, benefits, importance, and more.
The three pillars of observability
The three pillars of observability are its three primary data types – logs, metrics, and traces. Although many metrics give insights into system performance, nothing can touch these three pillars when you want to implement a successful data observability strategy. Each pillar offers unique insights into system performance. When put together, they give a complete picture of the infrastructure. Let's look closely at each pillar.
- Logs: Logs are typically human-readable, structured, or unstructured textual records of events that a system generates when it runs specific code. Simply put, it is a record of an event that happens within an application and is generated by servers and network devices. Logs are also generated by platform software, including middleware and operating systems. Log information is generally retrospective or historical, but some data is also visible in real-time. They provide extensive system details like faults and timings. They are an excellent source of identifying emergent and unpredictable behaviors that the components of a microservices architecture exhibit. Generally, every element of a distributed system can be customized to generate logs at any given point. Analyzing these logs helps organizations analyze system performance and identify the location and reason for an error. It also allows organizations to troubleshoot security incidents in databases, caches, and load balancers.
- Metrics: Unlike logs that only record specific events, metrics are values derived from system performance. They comprise a set of attributes like name, label, timestamp, and values that showcase information about SLOs, SLAs, and SLIs. Organizations rely on metrics to determine the overall behavior of a component or service over time due to its numerical representation of data. Metrics are real-time operating data accessed through a generated event, telemetry, or APIs using a polling or pull strategy. As metrics are event-driven, many fault management activities are derived from metrics. They are excellent time-savers because users can easily correlate them across infrastructure components to understand system performance and health holistically. Users can gather metrics on response time, system uptime, the number of requests, the amount of memory, or the processing power an application uses at any given time. Engineers and SREs typically use metrics to trigger alerts when system values exceed predefined thresholds.
- Traces: Although metrics and logs are sufficient to understand individual system performance and behavior, everyone relies on tracing to understand the entire lifecycle of a request, especially in a distributed system. This is because a trace encompasses the whole journey of an action or request as it passes through the different components of a distributed system. Traces allow you to observe and profile systems, especially microservice-based architectures, serverless architectures, and containerized applications. Organizations can pinpoint bottlenecks, measure the system's health, identify issues, resolve them faster, and prioritize areas that need optimization and improvement. Although traced data can be obtained from workflow processes like cloud-native microservices, service busses, and service meshing, it is good practice to set dedicated tracing tools in place to gain complete visibility during the software development phase. Traces indirectly assess an application's logic. Observability can only be complete with traces because they provide context for metrics and logs. It is a fundamental pillar of data observability.
Why observability?
Observability is a management strategy that keeps core issues that are extremely important at the top of an operations process flow. It separates critical information from regular information and helps organizations analyze & detect the significance of events to application security, software development lifecycles, and operations and tie them directly to end-user experience.
For years, organizations that banked on complex distributed systems to run their day-to-day operations have found it daunting to identify broken links and fix them in time. Identifying the root cause became critical, and observability grew out of this need. Instead of focusing on the state of elements in the system, it focuses on its overall condition and provides a clearer view of its functionality. It also supports the finest user and customer experience by allowing the detection of problems early and identifying root causes quickly.
Today's software delivery process is getting faster and more automated, making it harder to locate errors and broken links. Observability can keep up with this speed and does a great job of keeping a watch on the system. It is both proactive and reactive. It is proactive because it can detect areas where its presence may be lacking and add visibility to that area, and reactive because it prioritizes critical data first. Observability tools have made life easy for infrastructure and IT admin teams, with many seeing huge benefits. Let's see what it brings to the table.
Observability allows teams to:
- Monitor modern systems with high efficiency.
- Discover & associate errors in a complex chain and track the root cause.
- Gain visibility into the entire system architecture and digital business applications.
- Accelerate innovation.
- Enhance customer experience.
What are the benefits of observability?
Observability's primary benefit is that it enhances user experience by improving the availability of the application and boosting application performance. It speeds up the handling of errors and considerably brings down operations costs. This is done by prioritizing critical event notifications above redundant or irrelevant information. Larger organizations that have huge operations teams feel these improvements the most. Observability tools provide information helpful for performance management and reliability-boosting practices. Observability tools allow developers and engineers to create better customer experiences in today's complex digital enterprises. This is because all telemetry data types can be collected, explored, correlated, and alerted. Engineers get access to real-time performance data and can take proactive steps in case they see a deviation in the expected performance. It brings a positive impact on cross-team collaboration, and issues that are in nascent stages get resolved much faster. It ultimately boosts the DevOps process and enables organizations to push high-quality software to the market at an accelerated pace.
What is the difference between monitoring and observability?
Though they seem to be the same concept from the outside, observability and monitoring are quite different yet related and share a complex relationship. Conventional monitoring does not come close to observability when it comes to complex distributed systems and microservices. Traditional monitoring can flag something that goes wrong, but you will need observability to understand why it went wrong. Because the scope of data is larger in observability, it enables teams to explore what's happening, understand the cause, and take preventive action against further damage.
Monitoring vs observability - significant differences:
- Monitoring tools collect information that may or may not be significant because of the vast amount of data collected. Observability collects data and notifies teams of only what is relevant.
- Monitoring gathers information from APIs, logs, and management information bases. Observability uses these monitoring data sources and also adds new access points to collect information.
- Observability is a wider concept compared to monitoring. Monitoring is one of the techniques organizations use to achieve observability.
Observability and DevOps
Microservices have aided the increasing frequency of software deployment to a great extent. The world of microservices is too complex for teams to predefine possible points of failure in their environments. Observability helps DevOps teams with the flexibility to investigate hard-to-predict issues and test the systems in production while asking the right questions. It allows them to set clear SLOs and measure success with proper instrumentation. DevOps teams leverage data observability to orchestrate responses, rally around team dashboards and measure the effects of different changes to ultimately enhance the DevOps practices. Observability brings some significant benefits to DevOps: analyzing application dependencies, reviewing progress, inspecting infrastructure resources, and finding ways to improve user experience.
Observability best practices
Deciding to adopt observability is an excellent start, but ensuring that it is used to its full potential is what matters. Observability needs to sort through large datasets and perform analytics to produce actionable and clear output, but sorting through multiple large datasets makes analytics complex. The output needs to be actionable to save time, money, and resources. Here are the best practices to ensure the efficiency and effectiveness of your observability initiative:
- Set goals: Understand what you need to observe, why it is being observed, and what benefits you seek to derive by applying observability.
- Focus on relevant data: Ensure the data is relevant to the goals you establish, and steer clear of nonessential data.
- Optimize data: Review all data sources and add context to each source. If needed, alter your data collection to optimize it. For example, add details to logs or aggregate data to help you spot trends over time more efficiently.
- Seek actionable outputs: The scope of data is enormous, and crucial details are often lost just because of the large volume of data captured. Keep a lookout for meaningful data that will produce actionable outputs. For example, the effects of application and service downtime on users.
- Configure relevant results: Configure dashboards, alerting, and reporting so that they produce actionable outputs. For example, to reduce unnecessary noise, instead of setting static alerts, design time parameters that will waive a warning if the parameter achieves normalcy within a given timeframe.
- Proper channeling: Make sure that outputs follow the right channel and reach the concerned person/admin. For example, critical and non-critical reports go to separate teams. This ensures nothing slips through the cracks.
Get started with observability today!
Observability is vital for system optimization. It allows stakeholders to ask questions about the infrastructure and applications and get them answered in real-time. Thanks to the wealth of telemetry data, users get a real-time view of systems. If harnessed properly, they can take proactive measures in time. Well-designed observability tools produce all the analytics needed to enhance system output and keep up with modern distributed systems. Opcito's observability practices have been helping organizations of different sizes. If you are at the beginning of your observability journey or want to optimize the observability within your systems further, write to us at contact@opcito.com. We would love to provide you with expert assistance to achieve your observability goals.
In my next blog, I will be talking about the future of observability.

